On this page
Getting started: from install to your first dashboard
This guide is for a server owner who has never used Prometheus or Grafana and just wants to see graphs of their Vintage Story server. What else you need depends on how your server is hosted; the list right below sorts that out.
Pulse itself does not draw any graphs. It only serves a page of current numbers, /metrics, and
waits for something to come and read it. Prometheus is that something: a program that visits
/metrics on a timer and keeps a history of every number it finds. Grafana is the program
that turns Prometheus's history into the graphs you actually look at, arranged on a web page
called a dashboard. You need one of each: a ready-made setup you run yourself (path A), or
Grafana's own free hosted service (path B).
Which path is yours
- A Linux server you rent or administer. Install the mod (step 1), then path A on the server itself. View the dashboard from your own computer through an SSH tunnel, covered in path A.
- A home PC running the game server, on Windows, macOS or Linux. Install the mod, then path A: the Docker Desktop variant if it is Windows or macOS, and on Linux, whichever compose file matches what you installed: the Linux one for plain Docker Engine (the usual choice), the Docker Desktop one if you specifically installed Docker Desktop for Linux instead.
- A Windows Server host, or a panel-only host with no shell access (many rented game panels are like this). Skip straight to path B, Grafana Cloud: it needs nothing installed besides the mod itself.
- The game server itself runs inside a container (a Pterodactyl panel and similar). Path A
cannot reach it:
127.0.0.1inside that container is the container, not the machine underneath it. Use path B instead.
Step 1: install the mod on the server
This part is the same whichever path you pick, and it happens on the game server only, not on your own computer. Pulse needs Vintage Story 1.22 or newer.
Download
pulse_x.x.x.zip(replacex.x.xwith the version you downloaded) from the ModDB page or from GitHub releases.download pulse_0.2.0.zip version 0.2.0, released 2026-09-29
Drop the zip, unopened, into the server's
Mods/folder, the same place every other mod goes. By default that is:- Linux, the official server install script:
/home/vintagestory/data/Mods. - Linux, running the server binary yourself with no
--dataPath:~/.config/VintagestoryData/Mods. - Windows:
%AppData%\VintagestoryData\Mods(not%AppData%\Vintagestory, the install folder itself, a different place one word shorter). - A rented panel: wherever its file manager already shows your other mods; the panel has usually worked this out for you already.
- Linux, the official server install script:
Start (or restart) the server.
Watch the server's log for this line, which is Pulse confirming it is up:
Pulse serving metrics on http://127.0.0.1:9464/metrics
The log is either the console you started the server in, or
Logs/server-main.lognext toMods/. On a panel-only host, use whatever log view the panel gives you.If you have a terminal or browser on the server itself, confirm the page it just mentioned actually answers (no shell on a panel-only host: skip this check and go straight to path B below). The address is
127.0.0.1, meaning "this machine only", so this check has to run on the server, not on your own computer. Either openhttp://127.0.0.1:9464/metricsin a browser running on the server, or, from a terminal on the server, run:curl http://127.0.0.1:9464/metricsOn Windows PowerShell, type
curl.exe, not plaincurl: PowerShell aliasescurlto its ownInvoke-WebRequest, which takes different options and will not behave like the command above.Either way you should get back plain text, a long list of lines like
pulse_players_online 0. That text is what Prometheus will be reading in path A, and what the OTLP mod pushes onward in path B.
Pulse also wrote its own config file at this point, at ModConfig/pulse.json next to Mods/.
You do not need to touch it for either path below.
Path A: run Prometheus and Grafana yourself
Use this path if you are happy running two small programs yourself, on your own computer or on the server.
Before you start #
You need Docker installed. On Windows or macOS that always means Docker Desktop; see Docker's own install instructions. On Linux, that same page also offers Docker Desktop for Linux, a different product aimed at desktop use: it needs the Docker Desktop compose file below, not the plain Linux one. For the plain Linux one, install Docker Engine instead, from Docker's Engine install guide for your distribution.
Every command below starts with
docker compose(two words), which needs the current compose plugin. Installing from Docker's own repository, as the guides above do, gives you that directly. From your distribution's own repository instead, package names vary: Ubuntu calls itdocker-compose-v2, and on Debian 13 (trixie) the plainly-nameddocker-composepackage is already the current one, not the old, deprecated tool some other distributions still ship under that same name. If what you end up with only answers to a hyphenateddocker-compose, the commands below work identically with a hyphen instead of a space.If a command below fails with "permission denied" talking to the Docker daemon, either put
sudoin front of it, or add yourself to thedockergroup once, so future commands do not needsudoat all, following Docker's post-install steps, then log out and back in.You need the
contrib/grafanafolder from the Pulse repository:git clone https://github.com/StratumServer/Pulse.git cd Pulse/contrib/grafanaNo
giton a headless server? Installing it is usually simpler than the alternative:sudo apt install git(Debian or Ubuntu) or your distribution's equivalent, then the commands above. Otherwise, on the repository's GitHub page, use Code, Download ZIP, or go straight to the repository zip. Extract it and open a terminal in the extractedcontrib/grafanafolder.The first
docker compose up -ddownloads the Prometheus and Grafana images, a few hundred megabytes together, so it takes minutes, not seconds. Every run after that is fast.
On a Linux server or PC
Start Prometheus and Grafana together:
docker compose up -dBoth containers are set to restart automatically, including after this machine reboots, until you stop them in step 3.
Open
http://localhost:3000/d/pulse-overviewin a browser on the same machine. That is Grafana's "Pulse server overview" dashboard, already wired to Prometheus; nobody has to sign in. If you are sitting at that machine, that is it. If this is a rented server, open an SSH tunnel from your own computer instead of opening any port to the internet:ssh -L 3000:127.0.0.1:3000 -L 9090:127.0.0.1:9090 user@your-server(this also works from PowerShell on Windows 10 or 11), then open
http://localhost:3000/d/pulse-overviewon your own computer, as if Grafana were running locally.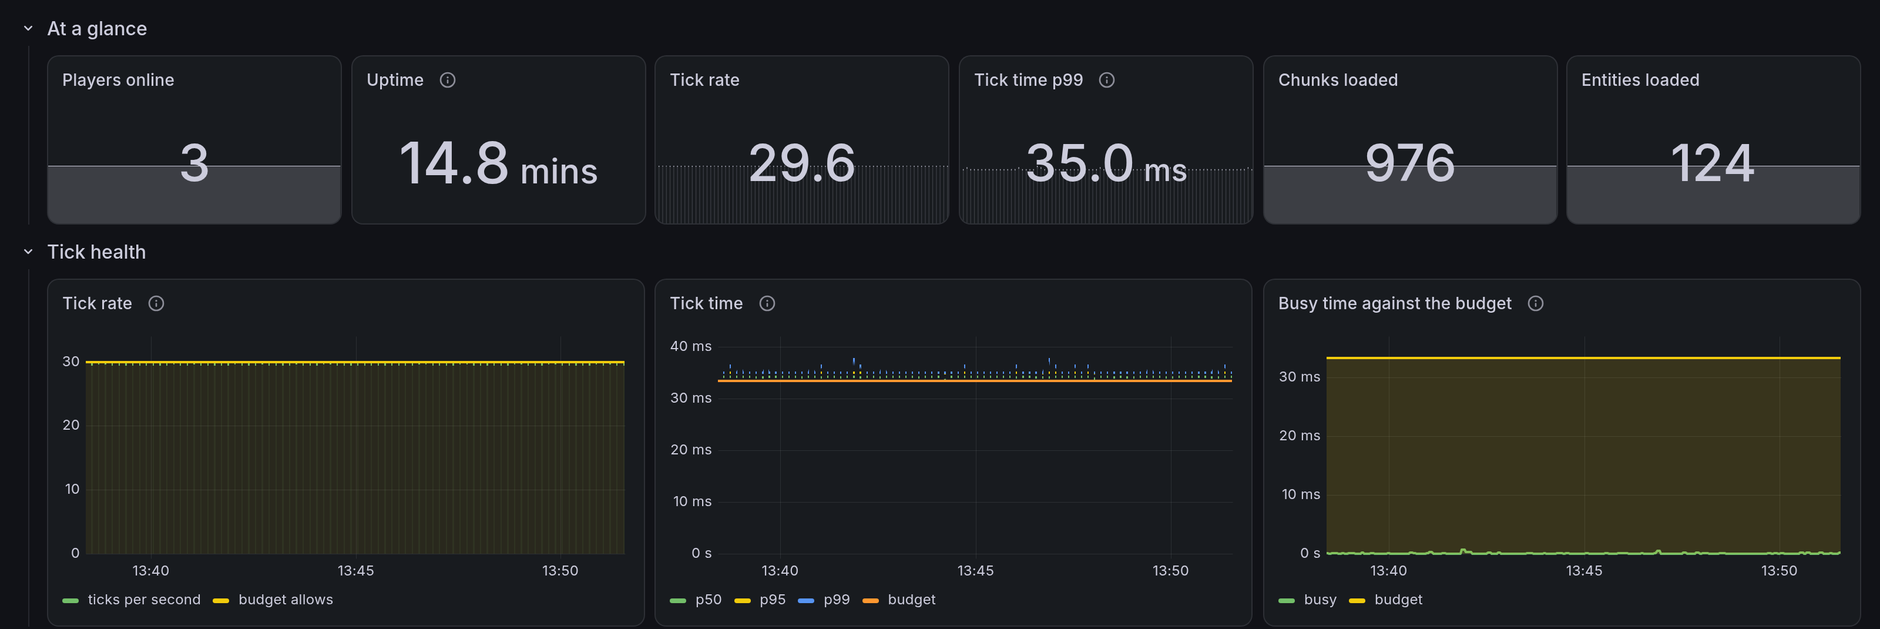
The "Pulse server overview" dashboard, here on a test server with three players and about 120 chickens. Yours shows your own numbers. When you are done, stop both programs from the same folder:
docker compose downThis does not keep any history: this setup uses no named storage, so both containers start empty again next time. That is fine for a first look; it is not a backup of anything.
This assumes Pulse is running on the same machine as this Docker setup, using the default
127.0.0.1:9464 from step 1. That works because the compose file uses "host networking": the
containers share the machine's own network instead of getting an isolated one, so 127.0.0.1
inside a container reaches the machine, same as outside it. Host networking like this is the
normal case on Linux; Docker Desktop added an opt-in host networking mode for Windows and macOS
in version 4.34, but it is off by default and this guide does not rely on it.
On Windows or macOS (Docker Desktop)
Start Prometheus and Grafana together, naming the Windows and macOS compose file:
docker compose -f docker-compose.desktop.yml up -dBoth containers are set to restart automatically, including after this machine reboots, until you stop them in step 3.
Open
http://localhost:3000/d/pulse-overviewin a browser on the same machine.The "Pulse server overview" dashboard, here on a test server with three players and about 120 chickens. Yours shows your own numbers. When you are done:
docker compose -f docker-compose.desktop.yml down
This file reaches Pulse through host.docker.internal, the address Docker Desktop provides for
reaching the machine it runs on from inside a container, since Desktop cannot use host networking
the way Linux does. Use this file when Pulse runs directly on this same Windows or macOS machine.
Docker Desktop is not available on Windows Server; use path B there instead. Both ports are
published to 127.0.0.1 only, on purpose: Grafana's anonymous access has no password of its own,
so nothing outside this machine should reach it.
Path B: Grafana Cloud, if you would rather host nothing
Use this path if you do not want to run Prometheus or Grafana yourself, or your host will not
let you. Grafana Cloud is Grafana's own hosted service, with a free tier: see
Grafana's pricing page for the current limits (10,000 metric
series, 14 day retention and 3 users, as of writing). This path needs a second, optional mod,
because nobody is coming to read /metrics for you; instead, the server pushes its numbers out
over the internet, using a protocol called OTLP.
Create a Grafana Cloud account yourself at grafana.com if you do not have one already.
In the Grafana Cloud portal at grafana.com (not the Grafana app itself), open your stack and find its OpenTelemetry tile. Click Configure, then "Generate now" (the exact wording may vary a little) to create an access policy token; it prints ready-to-use values, including
OTEL_EXPORTER_OTLP_ENDPOINTandOTEL_EXPORTER_OTLP_HEADERS. Use the endpoint as printed, something likehttps://otlp-gateway-<region>.grafana.net/otlp.From
OTEL_EXPORTER_OTLP_HEADERS, take everything afterAuthorization=, but change any%20back into an actual space. That printed value is itself encoded for use as an environment variable; Pulse encodes header values its own way before sending them, and the exporter decodes them again once they arrive, a round trip that leaves a real space untouched, but leaves a pasted%20exactly as pasted too, a literal%20instead of a space, which is not the header Grafana Cloud expects. If you ever need the instance ID by itself, read it from this same OpenTelemetry tile, not the separate Prometheus connection tile: Grafana Cloud gives each of them their own instance ID.Download
pulseotlp_x.x.x.zipnext topulse_x.x.x.zip, from the same ModDB page or GitHub releases, and drop it intoMods/as well.download pulseotlp_0.2.0.zip version 0.2.0, released 2026-09-29
Start the server once so the mod writes its own config file, then stop the server again.
Edit
ModConfig/pulse-otlp.json. Three keys change:{ "Endpoint": "https://otlp-gateway-<region>.grafana.net/otlp", "Protocol": "http/protobuf", "Headers": { "Authorization": "<everything after Authorization= from step 1>" } }Leave every other key as the mod wrote it.
Endpointis the base address only, Pulse adds the rest of the path itself.Start the server again. Look for a log line starting with
Pulse OTLP exporting, which confirms it is pushing on a timer; by default that timer is 60 seconds, so give it a minute.Confirm it arrived: in Grafana Cloud, open Explore, pick your Prometheus data source, and query
pulse_players_online. A value coming back means it worked.
Once the numbers are flowing, bring in the dashboard:
- In Grafana Cloud, go to Dashboards, then New, then Import dashboard.
- You never cloned the repository for this path, so download the dashboard file directly:
pulse-overview-shared.json(use that page's download button), then upload it in the Import dialog.download pulse-overview-shared.json same file as the GitHub link above
- It asks for a Prometheus data source (Grafana's name for a saved connection to somewhere it can pull numbers from). Pick the one your Grafana Cloud stack already created for you: Grafana Cloud stores OTLP metrics in its own Prometheus-compatible store, so this is the same data source your other Grafana Cloud graphs use.
- Open the imported dashboard. It is the same "Pulse server overview" dashboard as path A, and
every panel on it reads the same way over this OTLP path too.
The "Pulse server overview" dashboard, here on a test server with three players and about 120 chickens. Yours shows your own numbers.
Every panel on this dashboard reads the same over OTLP as it does from a direct scrape. That used to not be true: nine panels (the two per-second network panels, the two attribution share panels, and five in the Runtime row) stayed empty over OTLP, because Grafana Cloud's own translation from OTLP into Prometheus-style names did not match what the dashboard queried, tracked in issue #77. 0.2 fixed both sides of that mismatch: three instruments had the wrong declared unit, and the runtime panels now query the same translated names Grafana Cloud already produced, so nothing here needs a workaround any more. See the main README's Runtime metrics section and the changelog if a dashboard or alert you built against the old names still needs updating.
What next
- Dashboard
The dashboard covers every metric family the mod serves, grouped into rows. - Attribution
Tick busy time tells you the server is working hard. Attribution tells you what it is working on. - Alerts
Eleven rules across tick health, engine warnings, log errors, endpoint availability, the worldgen queue and per-mod attribution. - Install and configuration
Pulse and the OTLP mod each keep their settings in their own file underModConfig/, written with their defaults on first boot.
Troubleshooting #
docker compose up -dsucceeds, but a container keeps restarting. With host networking, a taken port does not show up as "port is already allocated" the way a published port would; the container starts, the program inside fails to bind the port, and Docker just restarts it in a loop. Rundocker compose psto see which container is stuck restarting, thendocker compose logs prometheusordocker compose logs grafanato read why. "Address already in use" on port 9090 is usually something else already listening there; on Rocky Linux, AlmaLinux or RHEL, that is often Cockpit's own web console, worth checking first. On the Docker Desktop variant, a taken port does show up as "port is already allocated" at startup instead, since those ports are published rather than shared directly. Either way, the remedy is the same as any port clash: stop whatever else is using it, or, on the Docker Desktop variant only, change the left-hand number in that service'sports:entry (for example"127.0.0.1:9091:9090") and open that new port instead; the Linux file has no such mapping to edit, so there the fix is always to free up the port.Pulse's own port, 9464, will not bind. That is unrelated to Docker: Pulse itself logs an error at startup and runs without the metrics endpoint until you fix it. Either free up port 9464, or set a different
PortinModConfig/pulse.json, restart the server, and update the target address inprometheus.ymlorprometheus.desktop.ymlto match. Prometheus only scrapes the address its config file names.Grafana opens, but the dashboard has no data at all. In Prometheus, open
http://localhost:9090/targets(through your SSH tunnel if this is a remote server). If thevintagestorytarget is notUP, Prometheus cannot reach Pulse: check that the server is running, and that the address inprometheus.yml(orprometheus.desktop.yml) matches where Pulse is actually listening.Some panels are empty, but others show data. Not every panel needs every setting. The Attribution row stays empty until you turn attribution on (see the main README's Attribution section), and a handful of engine-level panels (busy time, per-second network rates, the connection queue) go blank if Pulse is running in degraded mode, also covered in the main README. Both apply the same way on path B.
Path B: numbers never show up. An OTLP push that Grafana Cloud rejects costs nothing on the game side, but it no longer stays quiet: check the server's log, the console or
Logs/server-main.logfrom step 4 of installing the mod above, for a line startingPulse OTLP export to. A wrong or expired token reads like this:Pulse OTLP export to https://otlp-gateway-<region>.grafana.net/otlp/v1/metrics failed: Response status code does not indicate success: 401 (Unauthorized). The backend answered: {"code":16,"message":"authentication error: invalid scope provided"} Metrics are not reaching the backend; check Endpoint and Headers in pulse-otlp.json. This is logged again at most every 10 minutes.pulse-otlp.jsononly holds the already-encodedAuthorizationvalue, not a separate instance ID and token to eyeball, so the quickest fix is to go back to the OpenTelemetry tile, generate a fresh value, and paste it in again exactly as in step 1 of path B. No such line at all, this soon after starting the server, most likely just means the first push has not happened yet; give it one minute, the defaultIntervalSeconds, and check again.Nothing outside the server can reach
/metricsat all. That is by design, not a bug: the endpoint has no login of its own, so Pulse only listens on the server itself (127.0.0.1) unless you deliberately widen it. See the main README's bind address section before changing that.
127.0.0.1 inside that container is the container, not the machine underneath it. Use path B instead.
Source: docs/getting-started.md