On this page
Grafana kit
A ready-to-run Prometheus and Grafana pair for Pulse, the exact setup used to produce the
project's dashboard screenshots. The dashboard covers every metric family the mod serves,
grouped into rows: a glance strip of the numbers you check first, then tick health, attribution,
players, world, worldgen, network, pauses and warnings, and a runtime row at the bottom. Panels
that depend on something optional say so in their description, so an empty graph tells you why
it is empty instead of leaving you to guess. The runtime row needs RuntimeMetrics left on, and
busy time, the per-second network families and the connection queue all come from the engine
probe, which means they are blank on a server running in degraded mode. The attribution row is
the same kind of empty by default: it needs attribution switched on, either the config block or
/pulse attribution on, and stays blank until then (see the main README's Attribution section).
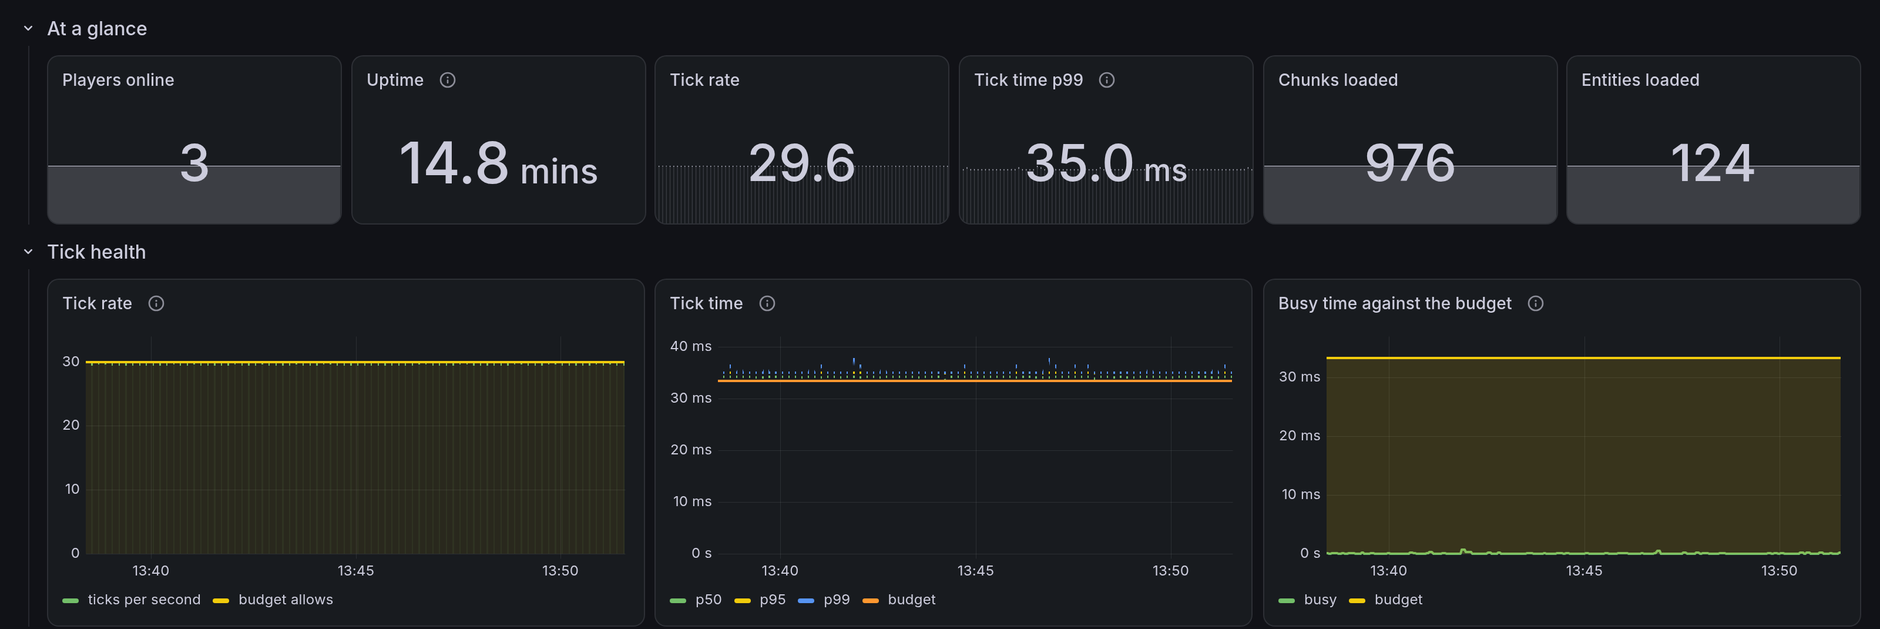
contrib/grafana, scraping a test server with three players and about 120 chickens. Provision it with two docker commands, or point your own Grafana at the same JSON.The easiest way to run this is docker-compose.yml in this folder (docker-compose.desktop.yml
on Windows or macOS instead), covered step by step in docs/getting-started.md: one
docker compose up -d instead of the two commands below. The commands here do the same thing
by hand, one container at a time; both use --rm, so unlike the compose files, neither comes
back on its own after a reboot.
With a Pulse-equipped server running on the same host (default bind, port 9464):
docker run -d --rm --name pulse-prom --network host \
  -v "$PWD/contrib/grafana:/etc/pulse" \
  prom/prometheus --config.file=/etc/pulse/prometheus.yml --web.listen-address=127.0.0.1:9090

docker run -d --rm --name pulse-graf --network host \
  -e GF_SERVER_HTTP_ADDR=127.0.0.1 \
  -e GF_AUTH_ANONYMOUS_ENABLED=true \
  -e GF_AUTH_ANONYMOUS_ORG_ROLE=Admin \
  -e GF_AUTH_DISABLE_LOGIN_FORM=true \
  -v "$PWD/contrib/grafana/provisioning:/etc/grafana/provisioning" \
  grafana/grafana
Then open http://localhost:3000/d/pulse-overview. The datasource and the dashboard are
provisioned from the files here; there is nothing to click together. Stop it all with
docker stop pulse-graf pulse-prom.
Both commands bind loopback only (--web.listen-address and GF_SERVER_HTTP_ADDR above), on
purpose. --network host puts both containers directly on the machine's own network, and
Grafana's anonymous access has no password of its own, so without that bind, an unauthenticated
admin account is one open port away from anyone who can reach this machine at all, not just from
it. To look at the dashboard from another computer, tunnel over SSH instead of widening either
bind:
ssh -L 3000:127.0.0.1:3000 -L 9090:127.0.0.1:9090 user@your-serverthen open http://localhost:3000 on your own computer. Run Grafana properly (real accounts, a real org role) if you keep it running longer than a first look.
Prometheus scrapes every 2 seconds here, which is pleasant for watching a test server live
and far denser than a production setup needs; 15 seconds is plenty for a real host. The panels
ask for $__rate_interval rather than a fixed window, so they follow whatever scrape interval
you settle on instead of going ragged at 15 seconds and lying at 60.
Importing it into a Grafana you already run #
Use pulse-overview-shared.json. In Grafana, go to Dashboards, then New, then Import dashboard,
upload that file, and pick your Prometheus datasource when it asks for one. That prompt is the entire difference
between the two dashboard files: the provisioned copy points at the datasource uid pulse-prom,
which exists only on a Grafana provisioned from this directory, so importing that one anywhere
else gets you a dashboard wired to nothing.
download pulse-overview-shared.json
You still need the scrape target from prometheus.yml.
The files #
provisioning/is what the Grafana container reads: the datasource, the dashboard provider, and the dashboard itself atprovisioning/dashboards/json/pulse.json, uidpulse-overview. This is the copy to edit.pulse-overview-shared.jsonis generated from that one, not maintained beside it. Edit the provisioned dashboard and regenerate.make-shared.pydoes the generating: it swaps the datasource for theDS_PROMETHEUSimport prompt and adds the__inputsand__requiresblocks Grafana's import dialog reads.check-dashboard.pylooks for the mistakes Grafana will not report. Overlapping panels, a panel wider than the 24 column grid and duplicate panel ids all get drawn wrong or dropped silently, which is a miserable thing to debug by eye.
So after editing the dashboard, run both:
python3 contrib/grafana/make-shared.py
python3 contrib/grafana/check-dashboard.py \
  contrib/grafana/provisioning/dashboards/json/pulse.json \
  contrib/grafana/pulse-overview-shared.json
Neither script needs anything beyond the Python standard library.
The panels #
37 panels in 9 rows, read from the dashboard file.
At a glance #
Players online stat
pulse_players_onlineReads: pulse_players_online
Uptime stat
The engine's own unpaused clock, not process uptime: it stops while the server is suspended for a save.
pulse_server_uptime_secondsReads: pulse_server_uptime_seconds
Tick rate stat
rate(pulse_server_ticks_total[$__rate_interval])Reads: pulse_server_ticks_total
Tick time p99 stat
The slowest one tick in a hundred. Compare it with the tick budget below: past the budget the server is dropping ticks.
histogram_quantile(0.99, sum by (le) (rate(pulse_server_tick_seconds_bucket[$__rate_interval])))Reads: pulse_server_tick_seconds
Chunks loaded stat
pulse_chunks_loadedReads: pulse_chunks_loaded
Entities loaded stat
pulse_entities_loadedReads: pulse_entities_loaded
Tick health #
Tick rate timeseries
Ticks completed per second against the rate the budget allows. They match on a healthy server; the gap is ticks the server could not fit into wall clock time.
rate(pulse_server_ticks_total[$__rate_interval])1 / pulse_server_tick_budget_secondsReads: pulse_server_ticks_total, pulse_server_tick_budget_seconds
Tick time timeseries
Wall clock between consecutive ticks, from the histogram. The budget line is the ceiling: ticks above it are overruns, and the sleep the engine would normally take is already zero there.
histogram_quantile(0.50, sum by (le) (rate(pulse_server_tick_seconds_bucket[$__rate_interval])))histogram_quantile(0.95, sum by (le) (rate(pulse_server_tick_seconds_bucket[$__rate_interval])))histogram_quantile(0.99, sum by (le) (rate(pulse_server_tick_seconds_bucket[$__rate_interval])))pulse_server_tick_budget_secondsReads: pulse_server_tick_seconds, pulse_server_tick_budget_seconds
Busy time against the budget timeseries
Time an average tick spent working, sleep excluded, against the budget it had. The gap is headroom, and busy time meeting the budget is a saturated server. Empty in degraded mode, since it needs the engine probe. The engine measures whole milliseconds, so a quiet server honestly reads zero.
pulse_server_tick_busy_secondspulse_server_tick_budget_secondsReads: pulse_server_tick_busy_seconds engine, pulse_server_tick_budget_seconds
Attribution, only when turned on #
Tick share by mod timeseries
Per-mod share of profiled main-thread tick time over the last completed burst; shares sum to 1 across every modid, including engine for core systems and unmarked time, and unattributed for marked work no loaded mod claims. Nothing to show until attribution has run at least once: set Attribution.Enabled in ModConfig/pulse.json, or run /pulse attribution on for an immediate look with no restart. Turning it off again clears the panel: the series disappears rather than freezing on the last burst, since attribution stops serving it the moment it is off, whether that is /pulse attribution off, a reload with Attribution.Enabled false, or attribution giving up on an unreadable profiler. It is blind to broadcast event handlers, which carry no markers at all. A thread-safe behaviour is not blind, it reads low, since only its main-thread slice gets marked; a side-library listener is not blind either, it lands in unattributed, since mapping is by assembly. Read the README's Attribution section before acting on one mod's number.
pulse_mod_tick_shareReads: pulse_mod_tick_share attribution
Current share by mod bargauge
The same shares as a snapshot instead of a trend: which mod is heaviest right now. Same sampling and blind spots as the panel to the left, and the same behaviour once attribution is off: the gauge goes empty rather than freezing on the last burst, so no bars here means attribution is not running, not that nothing costs anything.
pulse_mod_tick_shareReads: pulse_mod_tick_share attribution
Attributed tick time by mod timeseries
Attributed main-thread time per profiled tick, by mod: rate(pulse_mod_tick_seconds_total) divided by rate(pulse_attribution_ticks_total), the README's own recipe for comparing this across servers or tick rates. Sampled from inside the profiling bursts only, so read it like the share panel above, not like wall-clock time.
rate(pulse_mod_tick_seconds_total[$__rate_interval]) / ignoring(modid) group_left() rate(pulse_attribution_ticks_total[$__rate_interval])Reads: pulse_mod_tick_seconds_total attribution, pulse_attribution_ticks_total attribution
Profiling health timeseries
How much of the tick attribution is actually seeing, and whether to trust it. Profiled ticks per second should track the duty cycle configured in ModConfig/pulse.json (BurstTicks and IntervalSeconds); it only moves when a burst actually completes, which makes it the panel to check when the shares elsewhere look suspiciously constant between bursts, or empty because attribution is off. Dropped samples is a profiler reading that overflowed inside a single tick and should stay flat zero, since anything else means a marker ran for over two seconds.
rate(pulse_attribution_ticks_total[$__rate_interval])rate(pulse_attribution_dropped_samples_total[$__rate_interval])Reads: pulse_attribution_ticks_total attribution, pulse_attribution_dropped_samples_total attribution
Players #
Players online timeseries
pulse_players_onlineReads: pulse_players_online
Ping timeseries
Round trip time to the players online. Both series sit at zero with nobody connected, which is not a zero-latency server.
pulse_player_ping_secondsReads: pulse_player_ping_seconds
Player deaths, 5 minute window timeseries
increase(pulse_player_deaths_total[5m])Reads: pulse_player_deaths_total
World #
Chunks loaded timeseries
Refreshed on its own slow cadence, ChunksRefreshSeconds, 30 seconds by default. It steps rather than curves, and reads zero until the first refresh after startup.
pulse_chunks_loadedReads: pulse_chunks_loaded
Entities loaded timeseries
pulse_entities_loadedReads: pulse_entities_loaded
Entities by code timeseries
The ten most numerous entity codes, everything else summed into other. Same slow cadence as the chunk count. A stack climbing on one code is usually a breeding pen or a drifter horde.
pulse_entities_by_codeReads: pulse_entities_by_code
Worldgen #
Worldgen queue timeseries
Chunk columns waiting to be generated. A backlog that keeps growing means players are outrunning worldgen, usually behind someone on a fast mount.
pulse_worldgen_queue_columnsReads: pulse_worldgen_queue_columns
Columns generated timeseries
60 * rate(pulse_worldgen_columns_generated_total[$__rate_interval])Network #
Bytes per second by channel timeseries
The engine's own traffic rate over its last completed two second window, split TCP and UDP. Needs the engine probe. A window cut short by a suspend reads low for one sample.
pulse_network_bytes_per_secondReads: pulse_network_bytes_per_second engine
Packets per second by channel timeseries
Packet rate over the same engine window. Needs the engine probe.
pulse_network_packets_per_secondReads: pulse_network_packets_per_second engine
Traffic from the byte totals timeseries
The same traffic derived from the cumulative counters instead of the engine window. The TCP pair comes from the public API and survives degraded mode; the UDP pair does not.
rate(pulse_network_sent_bytes_total[$__rate_interval])rate(pulse_network_received_bytes_total[$__rate_interval])rate(pulse_network_udp_sent_bytes_total[$__rate_interval])rate(pulse_network_udp_received_bytes_total[$__rate_interval])Reads: pulse_network_sent_bytes_total, pulse_network_received_bytes_total, pulse_network_udp_sent_bytes_total engine, pulse_network_udp_received_bytes_total engine
Connection queue timeseries
Clients held in the queue because the server is full. Anything above zero is someone staring at a loading screen. Needs the engine probe.
pulse_connection_queue_clientsReads: pulse_connection_queue_clients engine
Pauses, warnings and logs #
Suspends, 5 minute window timeseries
Times the server stopped ticking. Every autosave is one of these, so a steady beat here is normal and a burst is not.
increase(pulse_server_suspends_total[5m])Reads: pulse_server_suspends_total
Seconds suspended, 5 minute window timeseries
Wall clock the world stood still. This is the freeze players actually feel during an autosave, and the number to bring to a complaint about lag spikes.
increase(pulse_server_suspend_seconds_total[5m])Engine warnings, 5 minute window timeseries
The engine's own health warnings, recognised from the text it logs. overload is a tick past 500 ms, memory is crossing 90% of DieAboveMemoryUsageMb, suspend_timeout is a suspend that gave up waiting for a thread, autosave_io is an autosave arriving while the previous one is still writing.
increase(pulse_engine_warnings_total[5m])Reads: pulse_engine_warnings_total
Log entries, 5 minute window timeseries
Lines the server logged, by severity. Error and fatal entries both count toward the engine's DieAboveErrorCount self-shutdown; fatal gets an alert of its own because it is the more severe level, not the only one that counts toward it.
increase(pulse_log_entries_total[5m])Reads: pulse_log_entries_total
Runtime, only with RuntimeMetrics on #
GC pause time timeseries
Seconds of garbage collector pause per second of wall clock, so 1% is one hundredth of the server's time spent not running the world.
rate(dotnet_gc_pause_time_seconds_total[$__rate_interval]) or rate(dotnet_gc_pause_time_total[$__rate_interval])Reads: dotnet_gc_pause_time_seconds_total, dotnet_gc_pause_time_total
GC collections per minute timeseries
60 * rate(dotnet_gc_collections_total[$__rate_interval])Reads: dotnet_gc_collections_total
Allocation rate timeseries
Bytes the server hands to the garbage collector every second. This is what sets the pace of the gen0 collections next door.
rate(dotnet_gc_heap_allocated_bytes_total[$__rate_interval]) or rate(dotnet_gc_heap_total_allocated_total[$__rate_interval])Reads: dotnet_gc_heap_allocated_bytes_total, dotnet_gc_heap_total_allocated_total
Managed heap after last collection timeseries
Heap size and the part of it lost to fragmentation, by generation, as measured at the end of the last collection. It updates in steps, not continuously.
dotnet_gc_last_collection_heap_size_bytes or dotnet_gc_last_collection_heap_sizedotnet_gc_last_collection_heap_fragmentation_size_bytes or dotnet_gc_last_collection_heap_fragmentation_sizeReads: dotnet_gc_last_collection_heap_size_bytes, dotnet_gc_last_collection_heap_size, dotnet_gc_last_collection_heap_fragmentation_size_bytes, dotnet_gc_last_collection_heap_fragmentation_size
Process memory timeseries
Working set is what the operating system sees the server holding, which is the number to compare against DieAboveMemoryUsageMb.
dotnet_process_memory_working_set_bytes or dotnet_process_memory_working_setdotnet_gc_last_collection_memory_committed_size_bytes or dotnet_gc_last_collection_memory_committed_sizeReads: dotnet_process_memory_working_set_bytes, dotnet_process_memory_working_set, dotnet_gc_last_collection_memory_committed_size_bytes, dotnet_gc_last_collection_memory_committed_size
CPU time timeseries
Seconds of CPU burned per second of wall clock, so 1 is one core fully busy. Vintage Story does most of its work on one thread, so the useful comparison is against 1, not against your core count.
rate(dotnet_process_cpu_time_seconds_total[$__rate_interval]) or rate(dotnet_process_cpu_time_total[$__rate_interval])Reads: dotnet_process_cpu_time_seconds_total, dotnet_process_cpu_time_total
Thread pool timeseries
Worker threads and the work waiting for them. A queue that does not drain is the pool being starved, often by blocking work on a pool thread. Both are published by the runtime as counters even though they go down as often as up, and Pulse renders the shape the runtime declares.
dotnet_thread_pool_thread_count_totaldotnet_thread_pool_queue_length_totalReads: dotnet_thread_pool_thread_count_total, dotnet_thread_pool_queue_length_total
Exceptions and lock contention per minute timeseries
Thrown exceptions and contended monitor locks. Both are cheap one at a time and expensive in a loop, and a mod misbehaving usually shows up here before it shows up in tick time.
60 * rate(dotnet_exceptions_total[$__rate_interval])60 * rate(dotnet_monitor_lock_contentions_total[$__rate_interval])Reads: dotnet_exceptions_total, dotnet_monitor_lock_contentions_total
Source: contrib/grafana/README.md, contrib/grafana/provisioning/dashboards/json/pulse.json