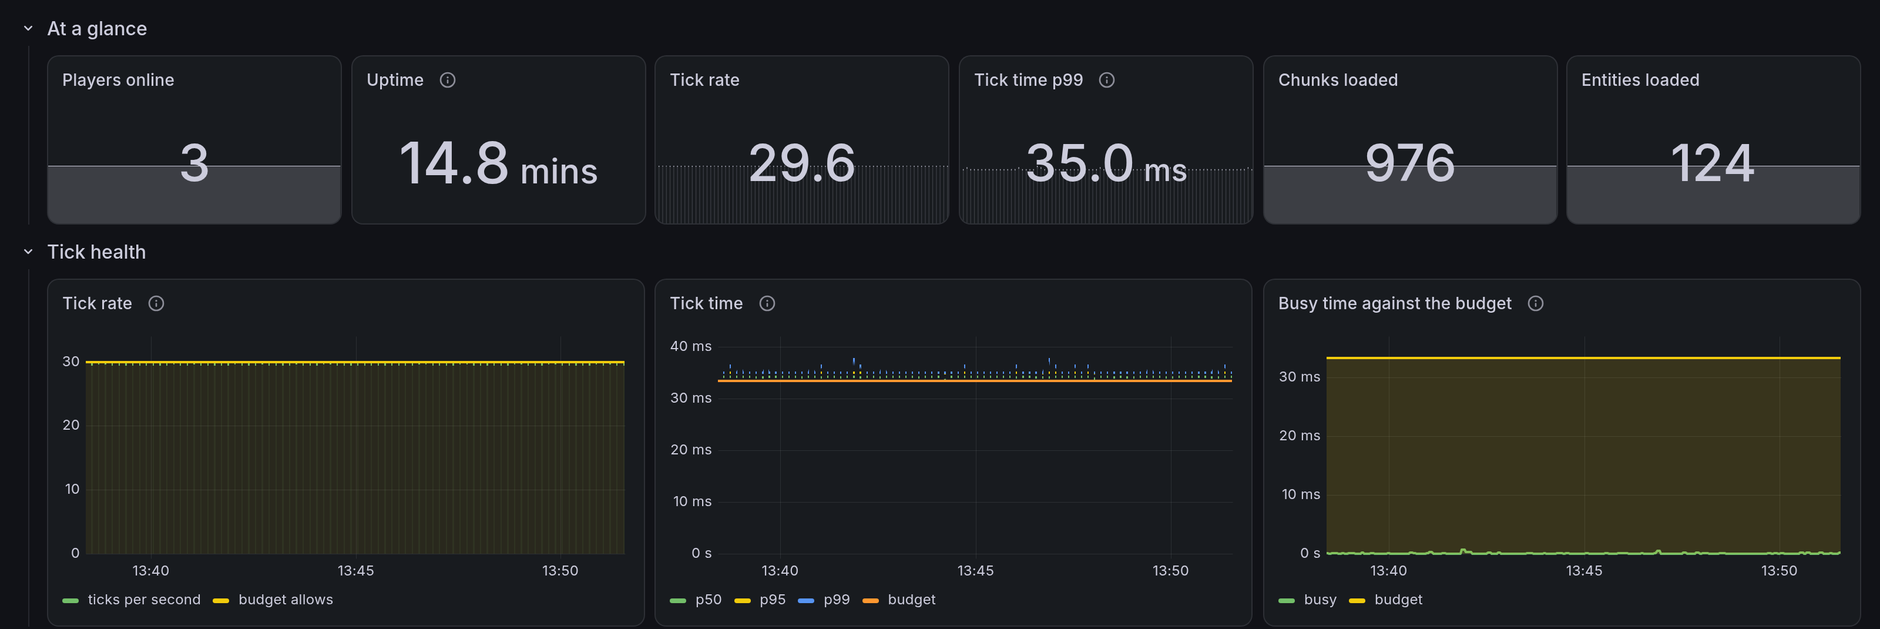
Sample output. One zip, no agent, no database, no account. Drop pulse_0.2.0.zip into Mods/, start the server, scrape.
What Pulse does> what_pulse_does
Pulse serves your server's own health numbers on a Prometheus scrape endpoint: tick rate and tick time, players and entities, network and autosave pauses, log health, and the .NET runtime underneath it. Nothing calls home, nothing needs an account, and it does not talk to anything unless something comes and reads /metrics. An optional second mod pushes the same numbers over OTLP for Grafana Cloud, Datadog or any collector that speaks it.
Choose your pill> choose_your_pill
[1] drop the zip
Put pulse_0.2.0.zip in your server's Mods/ folder and start it. Defaults land in ModConfig/pulse.json; upgrading fills in the new keys and keeps the ones you set.
This is your last chance. After this, there is no going back. Two ways to get the numbers out: choose one, or both.
[blue pill] pull
Prometheus scrapes /metrics from the base mod alone: point one at 127.0.0.1:9464 next to the server, or reach it from elsewhere through a tunnel or a reverse proxy. Bring up the bundled Grafana dashboard (contrib/grafana) with two docker commands, load the alert rules (contrib/alerts) into its Prometheus, or point your own Grafana at the same JSON.
Drop pulseotlp_0.2.0.zip in beside the base mod and it pushes every interval over OTLP: point Endpoint at a local OpenTelemetry collector, Grafana Cloud, Datadog, Honeycomb or New Relic. See how deep the rabbit hole goes.
New to Prometheus? Follow the white rabbit: the getting-started guide walks both pills end to end.
What you get> what_you_get
Tick health. Rate, time as a histogram (p95 and p99 are yours), the budget to read saturation against, and the engine's own busy time, showing load climb long before TPS drops.
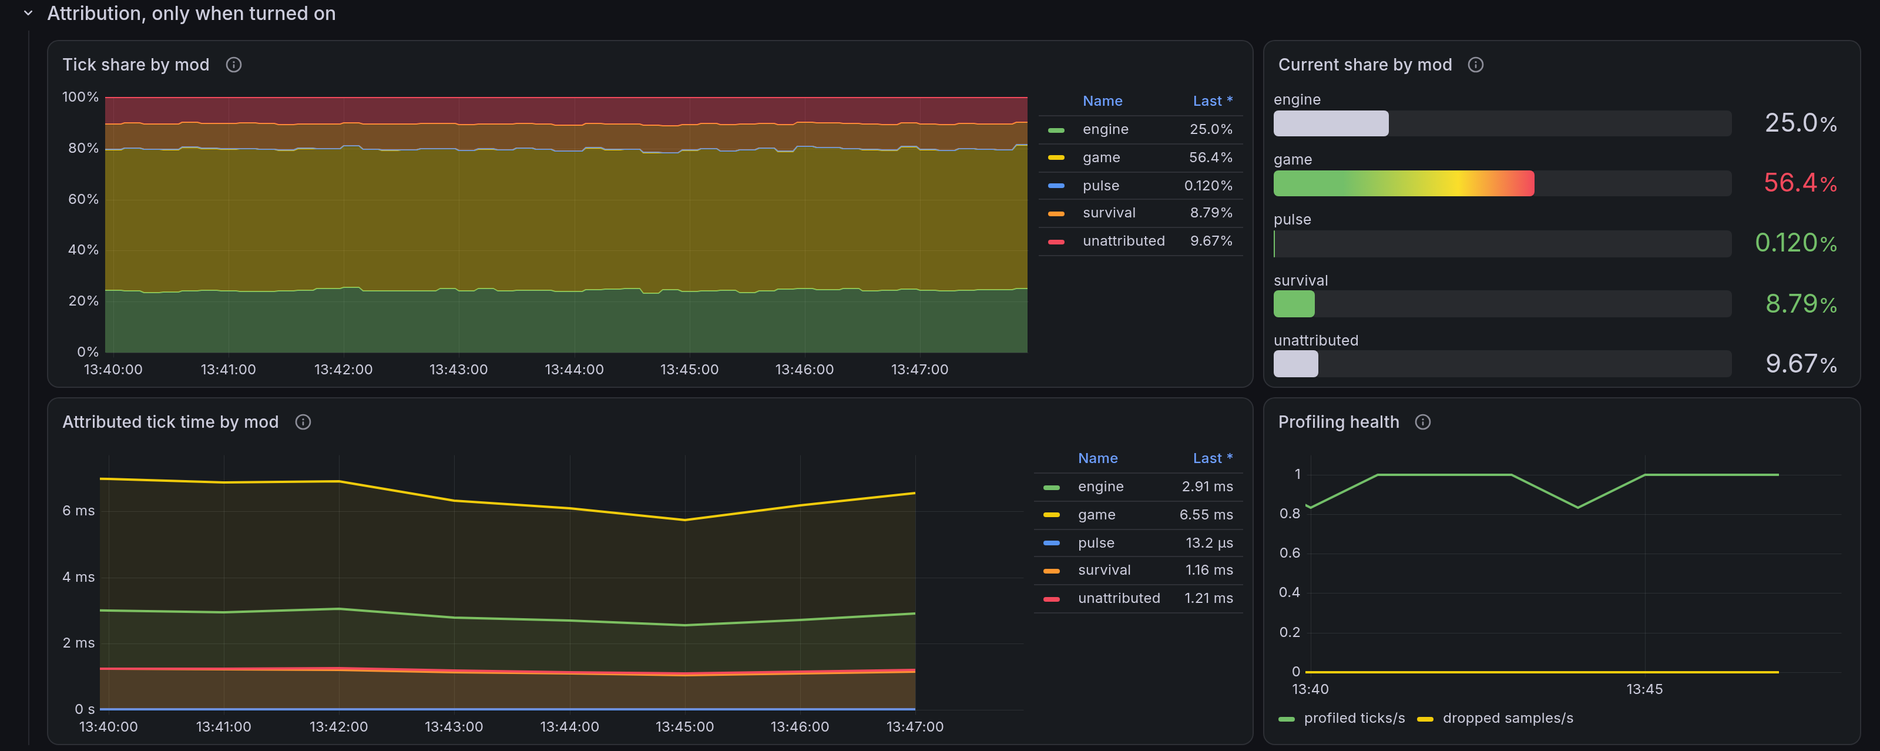
Per-mod attribution. Turn it on and see which mod is actually spending the tick, live, with a server command, no restart.
Players and world. Online count, ping, deaths; entities with a top-ten by type; chunks, worldgen queue, columns generated.
Network and pauses. TCP and UDP rates and totals; autosave suspends counted and timed, the freeze players actually feel.
Log health and runtime. Warning, error and fatal counters, four engine warnings worth alerting on, and the .NET runtime GC, heap, CPU and thread pool.
The dashboard bundled in contrib/grafana, scraping a test server with three players and about 120 chickens. Provision it with two docker commands, or point your own Grafana at the same JSON.
The Oracle> the_oracle
Tick busy time tells you the server is working hard. Attribution is the Oracle: ask, and it tells you which mod is actually eating the tick, a per-mod share of the main thread on a continuous series you can graph and alert on. It is off by default, because it costs tick time to measure. You play operator: /pulse attribution on and off jack it in and out of the running server live, no restart, so the moment you actually need it is not the moment you have to plan for it.
/pulse attribution on
start profiling, next burst one interval away
/pulse attribution off
stop, drop a burst in progress rather than half-publish it
/pulse attribution status
is it running, which cycle, how many ticks profiled
/pulse reload
re-read pulse.json and apply Attribution live
The cost is measured, not guessed: about 26% of the tick budget while a burst runs, blending down to about 0.9% amortised at the shipped default of ten ticks every ten seconds. It is a main-thread sample, not a full profiler: broadcast event handlers are not attributed to a mod by name, and thread-safe behaviours read low. Good for spotting which mod to look at next; for a real call tree, reach for a sampling profiler.
The bundled alert rules cover the obvious case too: a single mod that will not stop multiplying its share of the tick fires PulseModHoggingTick, Agent Smith replicating, and only while the server is genuinely under load, so a mod that is merely heavy on an idle server never pages anyone. Every other alert here is your deja vu: the glitch that means something in the Matrix actually changed.
Attribution row> attribution_row
A plain dedicated server running only the vanilla modules, Pulse and Pulse OTLP, attribution switched on with /pulse attribution on at the console and about 8,000 entities loaded. Pulse's own share stays near zero, 0.12% here; the engine, the game and survival take most of the rest, with about 10% left unattributed.